The SpaceNet data for Rio De Janeiro, Brazil is publicly available via the following AWS S3 bucket.
I used the following command lines to download the various files via AWS.
aws s3api get-object --bucket spacenet-dataset --key AOI_1_Rio/processedData/3band.tar.gz --request-payer requester 3band.tar.gz

aws s3api get-object --bucket spacenet-dataset --key AOI_1_Rio/processedData/8band.tar.gz --request-payer requester 8band.tar.gz

aws s3api get-object --bucket spacenet-dataset --key AOI_1_Rio/processedData/vectorData/geoJson.tar.gz --request-payer requester geoJson.tar.gz


aws s3api get-object --bucket spacenet-dataset --key AOI_1_Rio/processedData/vectorData/summaryData/AOI_1_Rio_polygons_solution_3Band.geojson --request-payer requester AOI_1_Rio_polygons_solution_3Band.geojson

aws s3api get-object --bucket spacenet-dataset --key AOI_1_Rio/processedData/vectorData/summaryData/AOI_1_Rio_polygons_solution_8Band.geojson --request-payer requester AOI_1_Rio_polygons_solution_8Band.geojson

aws s3api get-object --bucket spacenet-dataset --key AOI_1_Rio/processedData/vectorData/summaryData/AOI_1_Rio_polygons_solution_8Band.csv --request-payer requester AOI_1_Rio_polygons_solution_8Band.csv

aws s3api get-object --bucket spacenet-dataset --key AOI_1_Rio/processedData/vectorData/summaryData/AOI_1_Rio_polygons_solution_3Band.csv --request-payer requester AOI_1_Rio_polygons_solution_3Band.csv
To each satellite image in the folders 3band and 8band is an associated geoJSON file that outlines and labels the buildings in each image. Here is an example geoJSON file.
{
"type": "FeatureCollection",
"crs": { "type": "name", "properties": { "name": "urn:ogc:def:crs:OGC:1.3:CRS84" } },

"features": [
{ "type": "Feature", "properties": { "timestamp": "2016-06-22T21:33:54Z", "version": "1", "changeset": "5404", "user": "Derick", "uid": "43", "HGIS_OID": "999994.0", "building": "yes", "type": "None", "id": "way\/80720", "area": "None", "QAStatus": "Original_Building", "HGISOID": 999994.000000, "TaskArea": "West", "Revision1": "No", "Shape_Leng": 0.000613, "Shape_Area": 0.000000, "partialBuilding": 0 }, "geometry": { "type": "Polygon", "coordinates": [ [ [ -43.682227, -22.966324399999962, 0.0 ], [ -43.682047499999953, -22.966415299999937, 0.0 ], [ -43.682096, -22.966511, 0.0 ], [ -43.682273699999939, -22.9664165, 0.0 ], [ -43.682227, -22.966324399999962, 0.0 ] ] ] } },
{ "type": "Feature", "properties": { "timestamp": "2016-06-22T22:39:16Z", "version": "1", "changeset": "5405", "user": "Derick", "uid": "43", "HGIS_OID": "999996.0", "building": "yes", "type": "None", "id": "way\/133662", "area": "None", "QAStatus": "Original_Building", "HGISOID": 999996.000000, "TaskArea": "West", "Revision1": "No", "Shape_Leng": 0.000906, "Shape_Area": 0.000000, "partialBuilding": 0 }, "geometry": { "type": "Polygon", "coordinates": [ [ [ -43.6822976, -22.966530399999954, 0.0 ], [ -43.682263199999966, -22.966505, 0.0 ], [ -43.682019299999979, -22.966834899999981, 0.0 ], [ -43.682053699999983, -22.966860399999973, 0.0 ], [ -43.6822976, -22.966530399999954, 0.0 ] ] ] } }
]
}
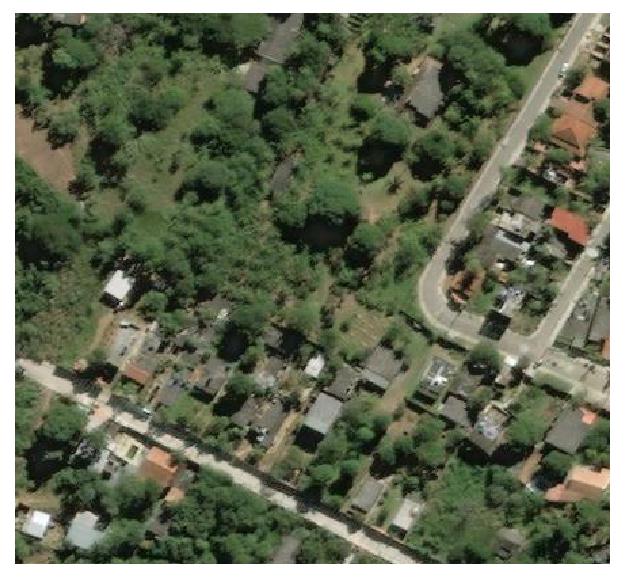
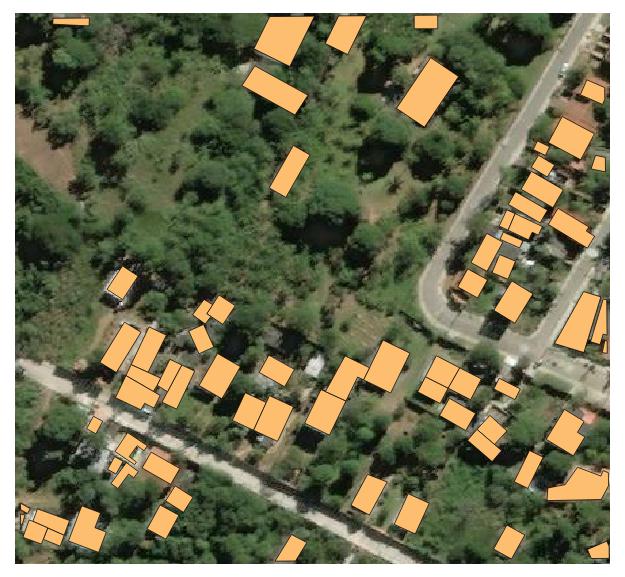
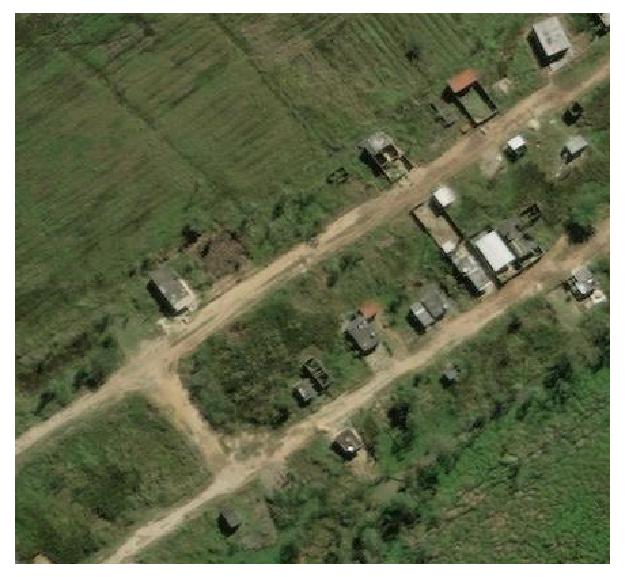
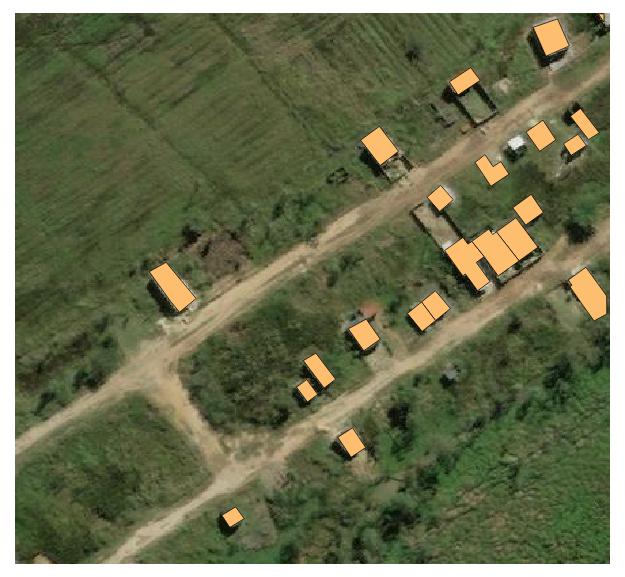
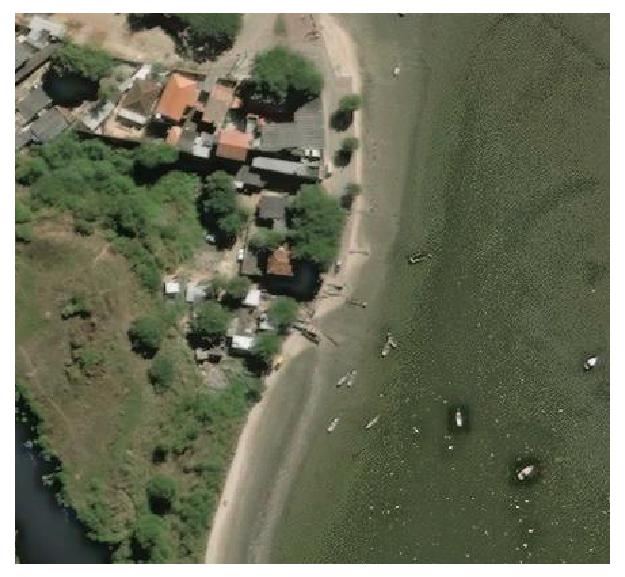
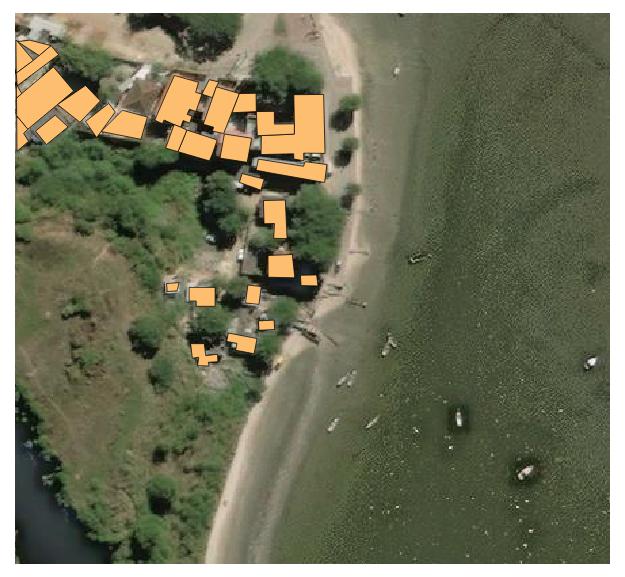
After downloading the data using the commands above, a first step is to view data in QGIS to get a feel for how the geoJSON files label the buildings within the SpaceNet images. Here are a couple of images with labels displayed using QGIS. These are 3-band images which are overlaid with the geoJSON for building footprints as orange polygons.
Warning: If you are using Anaconda to install and manage Python on a Mac, then QGIS is currently incompatible with Anaconda. It's ok, just follow the instructions available here and install QGIS on the default version of Python on your Mac.
That's it for getting the data.